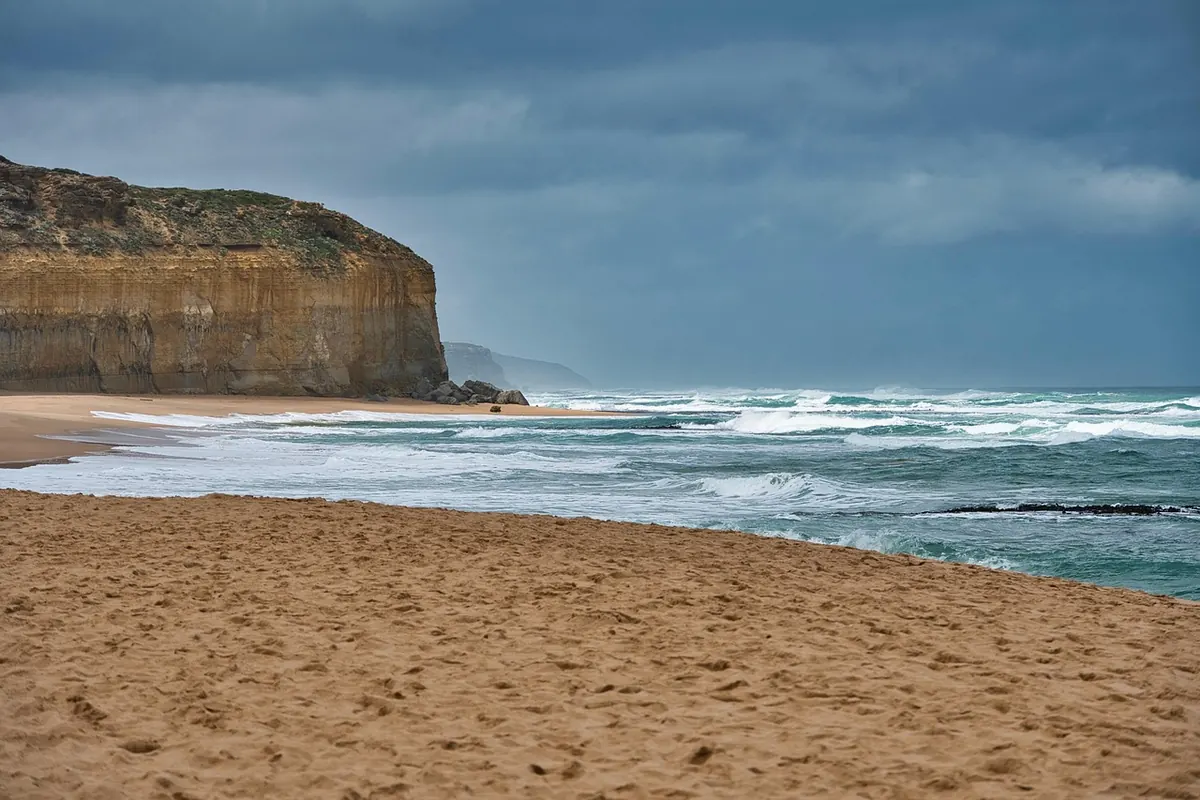
Coastal Erosion Reports: What New Shoreline Data Means for Local Homeowners
Every few years a new set of shoreline measurements lands on the desks of coastal councils, and every few years the numbers shift just enough that people living near the water look twice at the beach at the end of their street. The latest reports are no different. They combine beach profiles walked with measuring rods, aerial and drone imagery, and comparisons with older surveys to build a picture of where the coast is holding, where it is retreating, and where it is quietly rebuilding itself. None of it is dramatic in the way a winter storm is dramatic. It is slower than that, and in some ways more useful.
For a homeowner, the practical question is narrow: does this change anything about my house, my street, or my plans for the next ten years? Sometimes the honest answer is no. Sometimes it is "not yet, but watch it." And sometimes it is "yes, and you should start dealing with it while you still have room to move." Most of what follows is about telling those three cases apart without either panicking or falling asleep.
What the new shoreline figures actually describe
A shoreline report is not one line drawn on a map. It is a series of fixed measurement points, surveyed repeatedly over years, plus the width of the beach at those points, the height of the sand or shingle, and in many cases the condition of whatever sits behind it — a dune, a low wall, a row of beach huts, a road. Put those measurements side by side across a decade and you get a trend. Put them side by side across one season and you get noise.
That distinction is the single most useful thing to carry away from any coastal report. A beach that lost several metres in a stormy February may recover most of it by June, because sand moves offshore in winter and back onshore in calmer months. A beach that loses a little every year and never quite gets it back is telling a different story, even if the annual loss looks modest.
Trends matter more than single readings
When you read a summary of local findings, look for language about average change per year, about repeated loss at the same points, and about whether the losses are happening at the dune line, at the waterline, or both. A dune edge retreating while the waterline stays put often points to vegetation loss and foot traffic. Both edges moving together suggests something larger going on with sediment supply along the wider coast.
How the risk zones on the map are drawn
Councils and regional agencies do not usually publish a single "danger" line. They publish bands, and those bands are built from several ingredients that are worth knowing about, because each one is something a homeowner can partly influence or at least partly understand.
- Historic erosion rate. How fast the shoreline has moved landward at that point, averaged over a long enough period to smooth out storm years.
- Storm reach. How far inland waves and surge have been recorded reaching during significant events, not just average winters.
- Ground elevation. Two streets with identical beach frontage can behave very differently if one sits a metre higher.
- Defences and their condition. A wall that is maintained, mapped and inspected counts differently from one that has quietly crumbled behind a hedge.
- Sediment behaviour nearby. Harbours, river mouths, groynes and offshore banks all interrupt the movement of sand along the coast, sometimes starving a beach a kilometre away.
Because these ingredients are weighted differently from one municipality to the next, a house sitting in an "attention" band in one town might sit in a "monitored" band in the next. That is not necessarily inconsistency for its own sake; it often reflects different data histories. Still, it is worth asking which method was used for your area, and how old the underlying survey points are.
Two houses on the same street, two different answers
Coastal change is local in a way that surprises people. Along a single stretch of shore you can find a beach widening slightly at one end while a neighbour fifty metres away is losing ground, simply because of how a small headland or a harbour wall interrupts the drift of sand. Elevation adds another layer: a house on a slight rise may never see water at the door while the one at the bottom of the lane takes it twice a decade.
This is why generic advice about "living on the coast" is close to useless, and why the report for your own section of shoreline is worth reading in full rather than skimming the summary page. If a neighbour has had flooding and you have not, that is information, not luck.
What this means for insurance, valuations and paperwork
Insurers and lenders increasingly look at coastal hazard mapping, but they do not all look at the same maps or weigh them the same way. Some policies treat storm and flood damage differently depending on whether the property is in a mapped zone; some mortgage providers ask questions that did not exist a decade ago. Rather than guessing, it is worth a direct conversation with your insurer or broker about how your property is classified, and with a local surveyor or planning office if you are considering major works near the shoreline. Rules on building, extending, replacing walls and moving boundaries vary by municipality and can change, so treat anything you hear second-hand as a prompt to check the current position with the competent office.
On value, the honest framing is this: well-informed buyers now ask about coastal classification early, and a seller who can produce clear information — survey history, any defence maintenance records, evidence of what has actually happened on the property — is in a stronger position than one who shrugs. Uncertainty is what costs money, not information.
Practical steps for the next few months
- Find your section on the map. Locate the survey points nearest your property and note which band they fall into. Save a copy of the document with the date it was published.
- Record what you see. Photograph the dune edge, wall or beach access point from the same spot twice a year. A dated sequence of your own is remarkably persuasive later.
- Check your drains and levels. Many coastal property problems arrive as water coming from the wrong direction — blocked outfalls, low thresholds, inadequate soakaway.
- Keep vegetation in place. Dune and bank plants hold sand; foot traffic and informal paths undo that work quickly.
- Ask before you build. Any extension, new wall or hard surface near the shoreline should be checked against current local rules first.
- Talk to your neighbours. Shared defences, shared outfalls and shared access paths are almost always cheaper and better maintained when several households act together.
A calm way to think about a moving coastline
Coastlines move. That is not a modern crisis so much as a long-standing condition of living near water, and the useful response is neither denial nor alarm but a habit of paying attention once or twice a year. Read the report for your stretch, keep your own dated notes, understand how your property is classified for insurance and planning, and get professional advice where a decision genuinely matters — before a storm forces the question.
The data in these new shoreline reports will not tell you exactly what your street will look like in 2050, and anyone claiming otherwise is selling something. What it can do is show you the direction of travel, point out the handful of places where small actions still make a real difference, and give you time. Time, in coastal matters, is the most valuable thing on the list.
Photo: MemoryCatcher / Pixabay

You Might Also Like
Summer ferries and buses change timetables at different moments, and the connections that work in spring often fail in July. What shifts, what breaks, and how to plan around it.
Flat coastal roads look easy until wind, traffic and heat rewrite the plan. Here are the seven mistakes new riders make most often — and the simple fixes.